
Visualizing Kubernetes Metrics with Grafana
Install Grafana with Helm, connect it to Prometheus as a data source, import ready-made Kubernetes dashboards by ID, and watch the cluster's numbers change as you deploy pods.
Prometheus is now collecting metrics from every node and pod (from the previous lesson). But raw time series and PromQL queries are not what you want to look at during an incident. You want one screen that says: 2 nodes, 22 pods, memory at 30%, CPU spiking on this node.
Grafana is an open-source visualisation platform that builds dashboards from data in many sources: Prometheus, Kubernetes, AWS CloudWatch, Azure Monitor, Google Cloud, MySQL, PostgreSQL, Loki, even Google Sheets. It is not tied to Kubernetes. Here we point it at Prometheus.
Kubernetes cluster -> Prometheus (collects and stores metrics) -> Grafana (dashboards) -> youStep 1: Install Grafana with Helm
The lecture installs the chart from Grafana's original repository into the monitoring namespace:
helm repo add grafana https://grafana.github.io/helm-charts
helm install grafana grafana/grafana --namespace monitoring
WARNING: This chart is deprecated
NAME: grafana
NAMESPACE: monitoring
STATUS: deployed
REVISION: 1
NOTES:
1. Get your 'admin' user password by running:
kubectl get secret --namespace monitoring grafana -o jsonpath="{.data.admin-password}" | base64 --decode ; echo
...
WARNING: Persistence is disabled!!! You will lose your data when the Grafana pod is terminated.Use the grafana-community repository
The WARNING: This chart is deprecated line is real. The Grafana Helm chart moved to the grafana-community repository, and since 30 January 2026 updates are published only there. The old one still installs, but it no longer receives fixes. Use:
helm repo add grafana-community https://grafana-community.github.io/helm-charts
helm repo update
helm install grafana grafana-community/grafana --namespace monitoring
The release name grafana, the Service name and the password command stay the same.
The second warning means dashboards you create are stored inside the pod and disappear if it restarts. That is fine for a lab. For real use, install with --set persistence.enabled=true (needs a StorageClass) or keep dashboards as code.
Step 2: Get the admin password
The username is admin. The chart generated a random password and stored it in a Secret named grafana:
kubectl get secret --namespace monitoring grafana \
  -o jsonpath="{.data.admin-password}" | base64 --decode ; echo
The same base64 decoding you used for Secrets and for Argo CD. If you lose the command, helm status grafana -n monitoring prints the notes again. Keep the password private: do not paste it into chats, tickets or screenshots.
Step 3: Expose Grafana
kubectl get all -n monitoringGrafana and Prometheus objects are all there, and the grafana Service is ClusterIP. The lecture edits it to become a LoadBalancer:
kubectl edit svc grafana -n monitoringIn vi, press i, find type: ClusterIP near the end of spec, change it to type: LoadBalancer, then Esc and :wq. The same change as a single command:
kubectl patch svc grafana -n monitoring -p '{"spec":{"type":"LoadBalancer"}}'
kubectl get svc grafana -n monitoring
Wait 2 to 3 minutes for the load balancer, open http://<EXTERNAL-IP hostname> in the browser, and log in as admin with the password.
Safer for a lab: port-forward
A LoadBalancer puts the Grafana login page on the internet and costs money. kubectl port-forward svc/grafana -n monitoring 3000:80 --address 0.0.0.0 with port 3000 open only to your IP in the home server's security group does the same job for free. If you do use a LoadBalancer, change the admin password after the first login.
Step 4: Add Prometheus as a data source
On the home page choose Add your first data source (or Connections, Data sources, Add new data source) and pick Prometheus.
Set Prometheus server URL to the address of the prometheus-server Service inside the cluster:
http://prometheus-server.monitoring.svc.cluster.local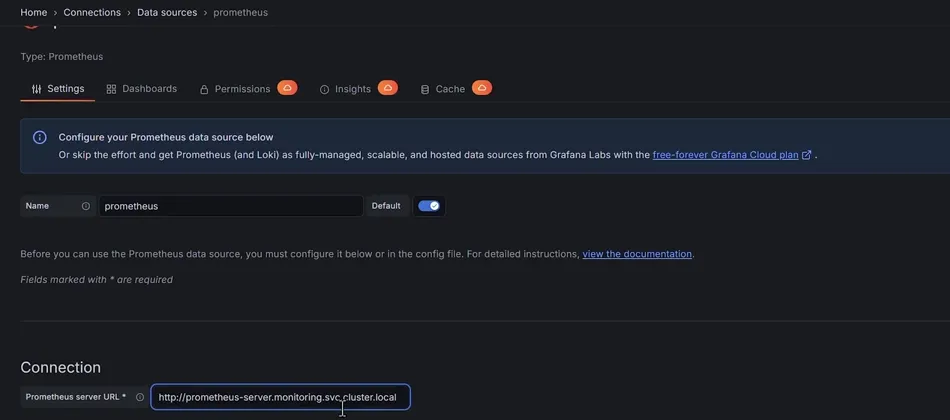
The Prometheus data source in Grafana. The URL is the cluster DNS name of the prometheus-server Service.
This is the cluster DNS name pattern <service>.<namespace>.svc.cluster.local. The Service listens on port 80, so no port is needed. Leave Authentication as No Authentication (Prometheus has none inside the cluster), scroll down and click Save & test. You should see a green "Successfully queried the Prometheus API" message.
Step 5: Import ready-made dashboards
You can build dashboards panel by panel, but the community has already published thousands at grafana.com/grafana/dashboards. Each has a numeric ID.
Go to Dashboards, New, Import, type the ID, click Load, select the prometheus data source, and Import.
| Dashboard ID | Shows |
|---|---|
15661 | A whole-cluster overview: nodes, namespaces, workloads, total pods, CPU and memory by node, network |
8171 | Kubernetes nodes only: idle CPU, system load, memory, disk I/O, disk space, network per node |
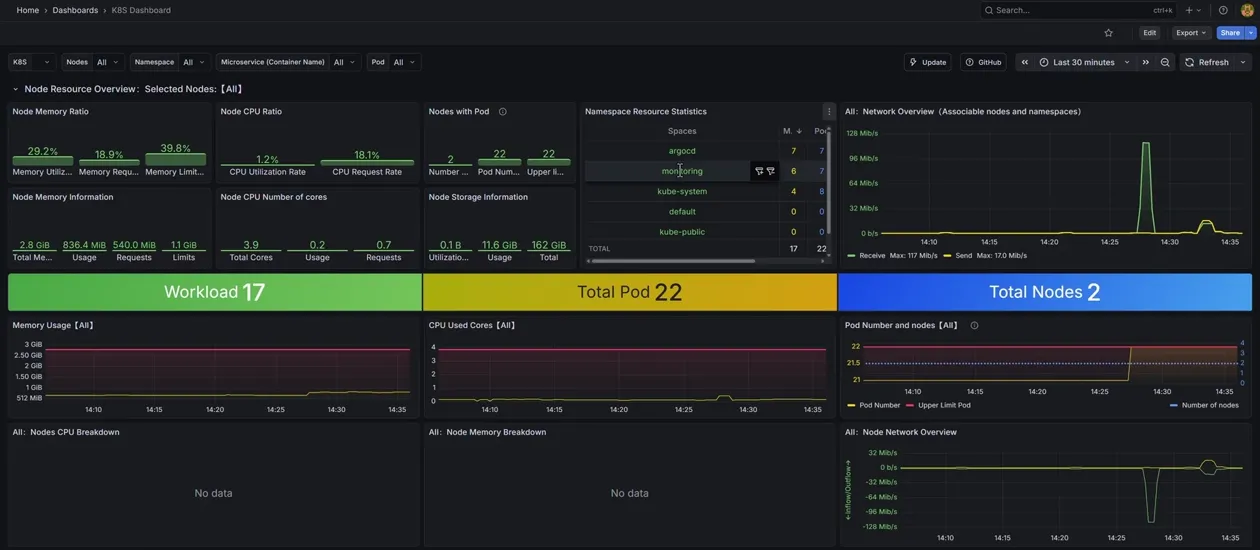
Dashboard 15661 on the course cluster: 2 nodes, 22 pods, and the argocd and monitoring namespaces we created.
Before you import a community dashboard, check on its page that it works with the exporters you have (here: node-exporter and kube-state-metrics from the Prometheus chart) and that it was updated recently. Some panels may show "No data" when a dashboard expects metrics or labels your setup does not have. That is normal; you can edit or remove those panels.
Step 6: Watch the numbers move
Deploy something from earlier lessons and refresh the dashboard:
kubectl apply -f k8s-deploy.yml
kubectl get pods
Within a scrape interval or two, Total Pod and Workload go up, and the CPU and memory graphs react. This is how teams spot problems: a node whose memory line keeps climbing, a namespace with far more pods than expected, a sudden network spike.
The lecture's first attempt used a YAML file that no longer worked, so only one pod became Ready. If pods do not start, kubectl describe pod shows the reason, as you learned in Kubernetes Pod Statuses.
What to explore next
- Explore (left menu): run PromQL queries ad hoc, for example
sum(rate(container_cpu_usage_seconds_total[5m])) by (namespace) - Alerting: create alert rules in Grafana, or use Prometheus Alertmanager
- More dashboards: Argo CD, CoreDNS, Node Exporter Full, and your own application's metrics from
/actuator/prometheus
Clean up
kubectl delete -f k8s-deploy.yml
kubectl patch svc grafana -n monitoring -p '{"spec":{"type":"ClusterIP"}}'   # removes the AWS load balancer
helm uninstall grafana -n monitoring
helm uninstall prometheus -n monitoring
kubectl delete namespace monitoring
Check EC2, Load Balancers to confirm the Grafana load balancer is gone.
Try It Yourself
- Import dashboard
8171, switch between your two nodes with the server drop-down, and compare their memory usage. - In Explore, write a query that shows the number of pods per namespace:
count(kube_pod_info) by (namespace). - Run the HPA load test from the HPA lesson and watch the pod count and CPU graphs in dashboard
15661. - Create your own dashboard with one panel: a time series of
sum(container_memory_working_set_bytes{namespace="monitoring"}). - Restart the Grafana pod (
kubectl delete pod -n monitoring -l app.kubernetes.io/name=grafana) and log in again. What happened to your imported dashboards, and why?
Official references
- Grafana: Prometheus data source
- Grafana: Import dashboards
- Grafana community Helm charts
- Grafana dashboards catalogue
Written By: Shramik Masti
How is this guide?
Last updated on
Kubernetes Monitoring and Installing Prometheus
Learn what observability means for a Kubernetes cluster, how Prometheus and Grafana work together, and install Prometheus on EKS with its Helm chart in a monitoring namespace.
Kubernetes Deployment Strategies: Blue-Green
Understand what a deployment strategy is, compare rolling update, recreate, blue-green, canary, shadow and A/B testing, and see how blue-green gives near-zero downtime and instant rollback.