
Kubernetes Monitoring and Installing Prometheus
Learn what observability means for a Kubernetes cluster, how Prometheus and Grafana work together, and install Prometheus on EKS with its Helm chart in a monitoring namespace.
Deploying an application is half the job. The other half is knowing how it behaves once it runs. Is a node running out of memory? Which pod is eating the CPU? Did the restarts start after the last release? Is a node about to become NotReady? Without data, you find out when users complain.
Observability is the ability to understand what is happening inside your applications and infrastructure from the data they produce. In DevOps it rests on three kinds of data:
| Signal | What it is | Examples |
|---|---|---|
| Metrics | Numbers measured over time | CPU, memory, network, disk usage, request rate, error rate |
| Logs | Text records of events | Application logs, system logs, kubectl logs output |
| Alerts | Notifications when something crosses a limit | "Node memory above 90% for 5 minutes", sent to email or Slack |
Many teams also add traces, which follow one request through several services. Observability helps developers and operations teams find and fix problems quickly.
The Metrics Server you met with the HPA only keeps the latest CPU and memory values. For history, graphs and alerts we need real monitoring tools.
Prometheus and Grafana
The most common open-source pair for Kubernetes monitoring:
| Prometheus | Grafana | |
|---|---|---|
| Role | Collects and stores metrics | Visualises metrics as dashboards |
| How | Pulls (scrapes) metrics from targets every few seconds and stores them in its time-series database | Queries data sources and draws graphs, tables and gauges |
| Without the other | Has data but only a basic UI | Has nice dashboards but no data |
| Query language | PromQL | Uses each data source's language |
So Prometheus is the data source and Grafana is the dashboard. Grafana asks Prometheus for numbers and shows them in a way people can read at a glance.
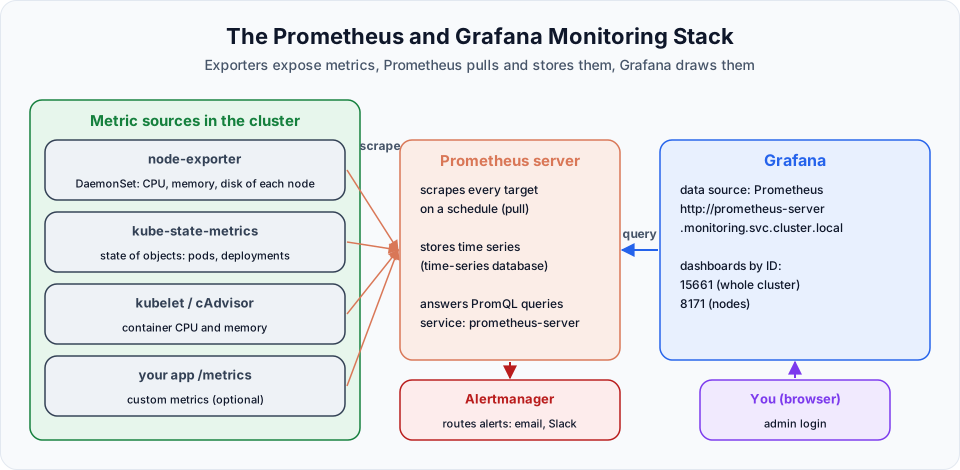
Where do the metrics come from? Small exporters expose them over HTTP:
- node-exporter: a DaemonSet that reports each node's CPU, memory, disk and network
- kube-state-metrics: reports the state of Kubernetes objects (desired vs ready replicas, pod phases, restarts)
- kubelet / cAdvisor: per-container CPU and memory
- Your application: Spring Boot exposes metrics at
/actuator/prometheuswith Micrometer
In this lesson we install Prometheus. In the next lesson we add Grafana on top.
Step 1: Find the chart
Open Artifact Hub and search for prometheus. Choose the prometheus chart from the prometheus-community repository (the official community charts). Its install tab gives the repository:
helm repo add prometheus-community https://prometheus-community.github.io/helm-charts
helm repo update
helm repo update refreshes the chart lists from all repositories, so you install the latest version.
Step 2: Create a namespace
kubectl create namespace monitoringKeeping monitoring tools in their own namespace makes them easy to find, secure and remove. (kubectl create ns monitoring is the short form.)
Step 3: Install Prometheus
helm install prometheus prometheus-community/prometheus \
  -n monitoring \
  --create-namespace \
  --set server.persistentVolume.enabled=false \
--set alertmanager.persistence.enabled=false| Part | Meaning |
|---|---|
prometheus | Release name. The main Service will be called prometheus-server |
prometheus-community/prometheus | <repository>/<chart> |
-n monitoring | Install into the monitoring namespace |
--create-namespace | Create the namespace if it does not exist (harmless here, since we already created it) |
--set server.persistentVolume.enabled=false | Store Prometheus data in an emptyDir instead of an EBS-backed PVC |
--set alertmanager.persistence.enabled=false | Same for Alertmanager |
The Alertmanager key in the lecture is wrong
The lecture passes --set alertmanager.persistentVolume.enabled=false. Alertmanager is a sub-chart, and its key is alertmanager.persistence.enabled. Helm silently ignores unknown keys, so with the lecture's command Alertmanager still asks for a PVC. On an EKS cluster without a default StorageClass, the prometheus-alertmanager-0 pod then stays Pending. Use the key shown above, or check any key with helm show values prometheus-community/prometheus.
Why disable persistence, and when not to
Without persistent storage, all collected metrics are lost when the Prometheus pod restarts. That is fine for learning, and it avoids paying for EBS volumes. In production you keep persistence on (it needs the EBS CSI driver and a StorageClass), set a retention period, and size the volume for it.
Step 4: See what Helm created
kubectl get all -n monitoringYou will see, among others:
| Object | Purpose |
|---|---|
deployment/prometheus-server | Prometheus itself: scraping, storage, queries |
statefulset/prometheus-alertmanager | Receives alerts from Prometheus and sends notifications |
daemonset/prometheus-prometheus-node-exporter | One pod per node, for node metrics |
deployment/prometheus-kube-state-metrics | Metrics about Kubernetes objects |
deployment/prometheus-prometheus-pushgateway | For short-lived jobs that push metrics instead of being scraped |
service/prometheus-server | ClusterIP Service on port 80. Grafana will use it |
Imagine writing all of that YAML by hand: Deployments, a DaemonSet, a StatefulSet, Services, ConfigMaps with scrape configuration, ServiceAccounts and RBAC rules. Helm did it with one command.
To peek at Prometheus itself before Grafana is ready, forward its port to the home server and open Status, Targets to see what it scrapes:
kubectl port-forward svc/prometheus-server -n monitoring 9090:80 --address 0.0.0.0Then browse to http://<home-server-public-ip>:9090 (allow port 9090 from your IP in the home server's security group), and press Ctrl+C when done. Try a query such as up or node_memory_MemAvailable_bytes.
The all-in-one alternative: kube-prometheus-stack
The same repository also has kube-prometheus-stack, which installs Prometheus (through the Prometheus Operator), Alertmanager, Grafana, node-exporter, kube-state-metrics and a set of ready-made Kubernetes dashboards and alert rules in one release. Many teams use it in production:
helm install monitoring prometheus-community/kube-prometheus-stack -n monitoringThe course installs Prometheus and Grafana separately, which shows more clearly how the two connect. Do not install both on the same cluster.
Clean up
Leave Prometheus running for the Grafana lesson. When you are finished with monitoring:
helm uninstall prometheus -n monitoring
kubectl get pvc -n monitoring        # delete any PVCs left behind
Try It Yourself
- Run
helm show values prometheus-community/prometheus | grep -n persistand find the persistence keys for the server and for Alertmanager. - List the node-exporter pods with
kubectl get pods -n monitoring -o wide | grep node-exporter. How many are there, and why that number? - Port-forward to Prometheus and run the query
kube_pod_container_status_restarts_total. Which pods have restarted? - Run
helm list -n monitoringandhelm status prometheus -n monitoringand read the notes again.
Official references
- Prometheus: Overview
- prometheus-community: prometheus Helm chart
- prometheus-community: kube-prometheus-stack Helm chart
- Kubernetes: Tools for Monitoring Resources
Written By: Shramik Masti
How is this guide?
Last updated on
Argo CD: Continuous Deployment for Kubernetes
Install Argo CD on EKS with Helm, open its UI, create an Application that tracks a Git repository, and watch a commit change the cluster with no kubectl apply.
Visualizing Kubernetes Metrics with Grafana
Install Grafana with Helm, connect it to Prometheus as a data source, import ready-made Kubernetes dashboards by ID, and watch the cluster's numbers change as you deploy pods.