
Auto Scaling in Kubernetes with Horizontal Pod Autoscaler (HPA)
Check the Metrics Server, set CPU requests on a Deployment, create an HPA with kubectl autoscale and with autoscaling/v2 YAML, generate load, and watch pods scale out and back in.
In the introduction we said the HPA adds pods when they get busy and removes them when they are idle. Now we make it happen on the EKS cluster: a Spring Boot Deployment that grows from 2 to 10 pods under CPU load, and shrinks again when the load stops.
On the way, the Metrics Server breaks, which is a very common real problem. We debug it step by step.
Step 1: Is the Metrics Server running?
kubectl top nodesNAME CPU(cores) CPU(%) MEMORY(bytes) MEMORY(%)
ip-192-168-12-34.ap-south-1.compute.internal 61m 3% 812Mi 57%
ip-192-168-45-67.ap-south-1.compute.internal 54m 2% 774Mi 54%If you see numbers, metrics work. Also check the Deployment:
kubectl get deployment -n kube-system | grep metricsmetrics-server 2/2 2 2 8hOn a cluster built with a recent eksctl it is already there as an EKS add-on (see the previous lesson). Do not install it again if it is already running.
Step 2: A Deployment with CPU requests
vi hpa-app.ymlapiVersion: apps/v1
kind: Deployment
metadata:
name: telusko-app
labels:
app: telusko-webapp
spec:
replicas: 3
selector:
matchLabels:
app: telusko-webapp
template:
metadata:
labels:
app: telusko-webapp
spec:
containers:
- name: webapp-container
image: <your-dockerhub-username>/springboot-app:latest
resources:
requests:
cpu: "100m"
memory: "128Mi"The only new part is resources.requests:
| Field | Meaning |
|---|---|
cpu: "100m" | Reserve 100 millicores (0.1 CPU) for this container. 1000m = 1 CPU, 500m = 0.5 CPU |
memory: "128Mi" | Reserve 128 mebibytes of RAM |
A request is what the scheduler reserves. It only places the pod on a node that still has 100m CPU and 128Mi memory unreserved. If no node has room, the pod stays Pending instead of overloading a node.
Why the HPA needs requests
An HPA CPU target like "20%" means 20% of the requested CPU. With a request of 100m, 20% is 20m. If a container has no CPU request, the HPA cannot compute a percentage and shows <unknown>. Always set requests on anything you autoscale.
kubectl apply -f hpa-app.yml
kubectl get pods
Step 3: Create the HPA with one command
kubectl autoscale deployment telusko-app --cpu=20% --min=2 --max=10| Flag | Meaning |
|---|---|
deployment telusko-app | What to scale. The HPA gets the same name |
--cpu=20% | Target: average CPU usage across pods at 20% of their request |
--min=2 | Never go below 2 pods, even with no load |
--max=10 | Never go above 10 pods, however high the load |
In real use a target of 50 to 80% is normal. We use 20% only so a small test load triggers scaling.
--cpu or --cpu-percent?
In the lecture, --cpu=20% failed with unknown flag: --cpu and --cpu-percent=20 worked. The lecture calls --cpu-percent the new flag, but it is the other way round. --cpu-percent is the older flag. --cpu (which also accepts quantities such as 500m, plus a matching --memory flag) was added in newer kubectl versions. If your kubectl is older, use:
kubectl autoscale deployment telusko-app --cpu-percent=20 --min=2 --max=10kubectl get hpaNAME REFERENCE TARGETS MINPODS MAXPODS REPLICAS AGE
telusko-app Deployment/telusko-app cpu: 1%/20% 2 10 3 40sTARGETS shows current usage / target. It can show <unknown>/20% for the first 30 seconds or so. If it stays <unknown>, see Step 5.
Step 4: Generate CPU load
We have no Service in front of the app, so the lecture creates load from inside one container. The Spring Boot image is based on Ubuntu, so apt-get works:
kubectl get pods
kubectl exec -it telusko-app-7d9c8b7f5d-abcde -- /bin/sh
Inside the container:
apt-get update
apt-get install -y stress
stress --cpu 8 --timeout 60s
stress --cpu 8 starts 8 workers that spin on the CPU, and --timeout 60s stops them after a minute. Run it again if you want the load to last longer.
In a second terminal connected to the EKS home server, watch:
kubectl get hpa -w
kubectl get pods -w
Installing packages in a running container is fine for a demo, but it changes a live container and needs internet access from the pod. The official HPA walkthrough uses a separate load generator instead, which works for any app behind a Service:
kubectl run load-generator --rm -it --image=busybox:1.28 --restart=Never -- \
  /bin/sh -c "while sleep 0.01; do wget -q -O- http://<service-name>; done"
Step 5: When the HPA says unknown (debugging the Metrics Server)
In the lecture, nothing scaled. Here is the investigation, in order.
kubectl describe hpa telusko-appWarning FailedGetResourceMetric ... failed to get cpu utilization: unable to get metrics for resource cpu: unable to fetch metrics from resource metrics APIThe HPA is fine. It cannot get data. Check the metrics API registration:
kubectl get apiservices | grep metricsv1.metrics.eks.amazonaws.com kube-system/eks-extension-metrics-api True 8h
v1beta1.metrics.k8s.io kube-system/metrics-server False (MissingEndpoints) 7h57mFalse (MissingEndpoints): the API server sends metrics requests to the metrics-server Service, and that Service has no pods behind it. Yet the pods are running:
kubectl get pods -n kube-system -l k8s-app=metrics-server      # No resources found
kubectl get pods -n kube-system | grep metrics                   # two pods, Running
That combination is the clue. Earlier in the lecture, the upstream components.yaml manifest had been applied on a cluster that already had the EKS metrics-server add-on. The two installs use different labels. The upstream manifest selects pods with k8s-app=metrics-server, while the add-on's pods carry other labels. Applying the manifest overwrote the Service's selector, so the Service no longer matched the running pods, and its endpoints were empty.
The fix: use one installation. The lecture removed the add-on and re-applied the upstream manifest:
aws eks delete-addon --cluster-name telusko-learning --addon-name metrics-server --region ap-south-1
# wait 2 to 3 minutes, then
kubectl apply -f https://github.com/kubernetes-sigs/metrics-server/releases/latest/download/components.yaml
aws eks delete-addon has no --no-wait option (that caused the first error in the lecture), and a stray : typed before aws gives Command ':aws' not found.
The other valid fix is to keep the managed add-on and remove the upstream objects, or delete and recreate the add-on with eksctl create addon --name metrics-server --cluster telusko-learning --region ap-south-1. Either way, check that it is healthy:
kubectl get apiservices v1beta1.metrics.k8s.io      # AVAILABLE must be True
kubectl top pods
Step 6: Watch it scale out
With metrics working and the load running:
kubectl get pods -wtelusko-app-7d9c8b7f5d-4q8zx 0/1 Pending 0 0s
telusko-app-7d9c8b7f5d-4q8zx 0/1 ContainerCreating 0 1s
telusko-app-7d9c8b7f5d-4q8zx 1/1 Running 0 6s
...kubectl get hpaNAME REFERENCE TARGETS MINPODS MAXPODS REPLICAS AGE
telusko-app Deployment/telusko-app cpu: 187%/20% 2 10 10 6mTen pods, the maximum. The HPA will not go beyond --max however high the load.
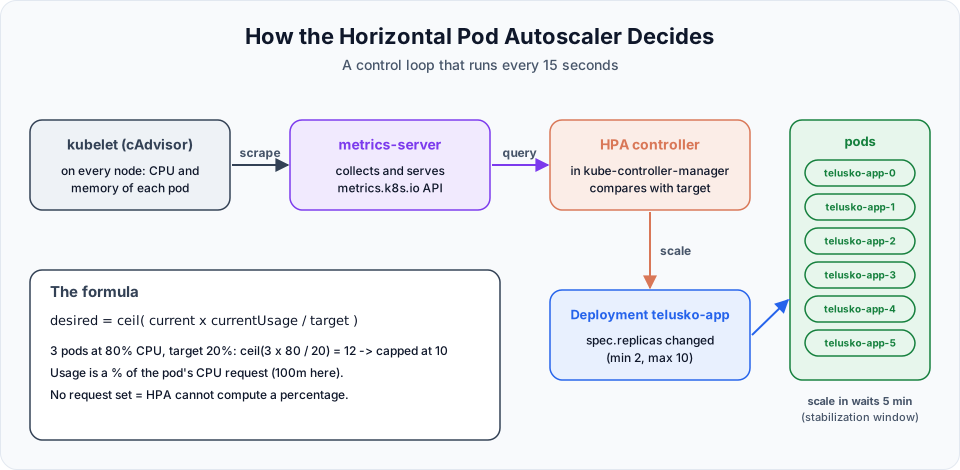
How the HPA decides, every 15 seconds:
desiredReplicas = ceil( currentReplicas x currentUsage / targetUsage )With 3 pods at an average of 80% and a target of 20%: ceil(3 x 80 / 20) = 12, capped at maxReplicas = 10. If the result is within 10% of the current count, the HPA does nothing (this tolerance avoids constant small changes).
Step 7: Scale in, slowly on purpose
Stop the load (Ctrl+C in the container, or wait for --timeout). The pods do not disappear immediately. By default the HPA waits for a 5-minute stabilization window before scaling down: it uses the highest recommendation of the last 5 minutes. This prevents flapping when load goes up and down quickly. After that, the replicas drop back towards minReplicas: 2.
Step 8: The same HPA in YAML
Commands are good for experiments. In real projects the HPA lives in Git next to the Deployment. Delete the command-made objects first:
kubectl delete hpa telusko-app
kubectl apply -f hpa-app.yml
vi hpa.ymlapiVersion: autoscaling/v2
kind: HorizontalPodAutoscaler
metadata:
name: telusko-app-hpa
spec:
scaleTargetRef:
apiVersion: apps/v1
kind: Deployment
name: telusko-app
minReplicas: 2
maxReplicas: 10
metrics:
- type: Resource
resource:
name: cpu
target:
type: Utilization
averageUtilization: 20| Field | Meaning |
|---|---|
apiVersion: autoscaling/v2 | The current HPA API, with multiple metrics and behavior. The old autoscaling/v2beta2 was removed in Kubernetes 1.26 |
scaleTargetRef | The object to scale: a Deployment, StatefulSet or ReplicaSet, by name |
minReplicas / maxReplicas | The range the HPA may use |
metrics[].type: Resource | Use CPU or memory from the Metrics Server |
target.type: Utilization, averageUtilization: 20 | Keep average CPU at 20% of requests. type: AverageValue with averageValue: 50m targets an absolute value instead |
kubectl apply -f hpa.yml
kubectl get hpa
Repeat the load test from Step 4 and watch the pods grow to 10 again.
You can scale on several metrics at once, for example CPU and memory. The HPA calculates a replica count for each and uses the largest. You can also tune speed with spec.behavior:
  behavior:
    scaleDown:
      stabilizationWindowSeconds: 60    # default 300
Do not fight the HPA
Once an HPA manages a Deployment, the HPA owns replicas. If your YAML says replicas: 3 and you re-apply it while the HPA has scaled to 8, you reset it to 3 and the HPA scales back up. Many teams remove replicas from the Deployment YAML once an HPA is in place.
Clean up
kubectl delete -f hpa.yml
kubectl delete -f hpa-app.yml
The lecture uses kubectl delete all --all, which also removes HPAs in the namespace (they are part of all), but be careful with it on any shared cluster.
Try It Yourself
- Change the target to 50% and repeat the test. How many replicas do you reach with the same
stress --cpu 8? - Add a second metric for memory with
averageUtilization: 70. Readkubectl describe hpaand see both metrics. - Set
behavior.scaleDown.stabilizationWindowSeconds: 30and time how fast the pods scale in after the load stops. - Remove the CPU request from
hpa-app.yml, re-apply, and look atkubectl get hpa. What doesTARGETSshow and why? - Put the Deployment behind a ClusterIP Service and generate load with the busybox
load-generatorcommand instead ofstress.
Official references
- Kubernetes: Horizontal Pod Autoscaling
- Kubernetes: HorizontalPodAutoscaler Walkthrough
- kubectl reference: autoscale
- Amazon EKS: View resource usage with the Kubernetes Metrics Server
Written By: Shramik Masti
How is this guide?
Last updated on
Kubernetes Autoscaling Introduction
Understand what autoscaling is, the difference between horizontal and vertical scaling, the autoscalers Kubernetes and EKS offer, and why the Metrics Server must be running first.
Kubernetes ResourceQuota
Limit how many pods and how much CPU and memory a namespace can use with a ResourceQuota, see pods rejected when the budget is exceeded, and fix the Deployment to fit.