
Monitoring and Observability
Monitoring and Observability are practices used to continuously track the health, performance, and behavior of a system. They help ensure that applications and infrastructure are functioning correctly and allow teams to quickly detect, investigate, and resolve issues.
They answer important questions such as:
- Are there any errors in the system?
- Is every component working as expected?
- What is the overall health of the system?
- Are all edge cases and scenarios being handled correctly?
- Are alerts triggered when a service or component goes down?
Monitoring vs Observability
Although these terms are often used together, they serve different purposes.
| Monitoring | Observability |
|---|---|
| Tracks predefined metrics, logs, and alerts. | Helps understand the internal state of the system using metrics, logs, and traces. |
| Answers "Is something wrong?" | Answers "Why is something wrong?" |
| Detects failures and abnormal behavior. | Helps diagnose root causes and investigate failures. |
| Focuses on known problems. | Helps identify unknown or unexpected problems. |
Monitoring
Monitoring is the process of collecting and tracking predefined metrics to determine whether a system is operating within expected limits.
Common Monitoring Metrics
- CPU utilization
- Memory consumption
- API response times
- Error rates
- Server availability
Monitoring answers:
"Is something wrong?"
Observability
Observability is the ability to understand the internal state of a system by analyzing its outputs such as:
- Metrics
- Logs
- Traces
Observability is especially important in distributed systems, where requests travel across multiple services.
It helps engineers:
- Investigate failures
- Identify bottlenecks
- Trace requests across services
- Understand why an issue occurred
Observability answers:
"Why is something wrong?"
API Monitoring
API Monitoring focuses on tracking the performance, availability, and reliability of application endpoints.
Since APIs act as the communication layer between clients and backend services, monitoring them is essential for maintaining application health.
1. Throughput
Throughput measures the number of requests processed by the system within a given period of time.
Importance
- Indicates application load
- Helps determine system capacity
- Assists in scaling decisions
Example
If a service processes 10,000 requests per minute, its throughput is:
10,000 Requests Per Minute (RPM)2. Error Monitoring
Error monitoring tracks unsuccessful requests and HTTP response codes.
Common HTTP Status Code Categories
| Status Code | Meaning |
|---|---|
| 2xx | Successful requests |
| 3xx | Redirections |
| 4xx | Client-side errors |
| 5xx | Server-side errors |
Importance
- Detects application failures
- Identifies deployment issues
- Improves service reliability
Alerts should be triggered when error rates exceed predefined thresholds.
3. Health Checks
Health checks continuously verify whether an application or service is operational.
Purpose
- Confirms service availability
- Detects failures quickly
- Supports automated recovery
- Helps load balancers route traffic only to healthy instances
A healthy service typically responds with:
HTTP 200 OK4. Latency Monitoring
Latency measures the time required for a system to respond to a request.
Importance
- Directly impacts user experience
- Helps identify performance bottlenecks
- Assists in capacity planning
Lower latency generally indicates better system performance.
Understanding Latency Percentiles
Average latency alone may not accurately represent user experience because a few slow requests can significantly affect users.
Production systems therefore use latency percentiles.
P90 (90th Percentile)
A P90 latency of 200 ms means:
- 90% of requests complete within 200 ms
- 10% take longer than 200 ms
P95 (95th Percentile)
- 95% of requests complete within the specified time
- Only 5% are slower
P99 (99th Percentile)
- 99% of requests complete within the specified time
- Represents the worst-case experience for almost all users
Why Percentiles Matter
Percentile-based monitoring provides a more accurate view of performance because it highlights slow requests that average latency often hides.
System Monitoring (Infrastructure Monitoring)
Infrastructure monitoring focuses on the health and utilization of the underlying hardware and system resources.
It helps prevent outages, resource exhaustion, and performance degradation.
1. CPU Usage
CPU monitoring tracks processor utilization across servers.
Importance
- Identifies overloaded systems
- Indicates when scaling is required
- Prevents performance degradation
Alerts are commonly configured when CPU usage exceeds a threshold such as 80%.
2. Memory Usage
Memory monitoring tracks RAM consumption.
Importance
- Prevents out-of-memory failures
- Detects memory leaks
- Optimizes resource allocation
Consistently high memory usage may indicate application inefficiencies.
3. Disk I/O
Disk Input/Output monitoring measures read and write operations performed on storage devices.
Importance
- Detects storage bottlenecks
- Identifies slow database operations
- Maintains application performance
High disk utilization can significantly increase response times.
4. Network I/O
Network monitoring measures incoming and outgoing network traffic.
Importance
- Detects traffic spikes
- Identifies network bottlenecks
- Troubleshoots communication issues between services
Abnormal traffic patterns may indicate:
- Service failures
- Cyber attacks
- Network misconfigurations
Alerting and Incident Detection
Monitoring is effective only when combined with proper alerting mechanisms.
Alerts should be configured for critical metrics such as:
- High CPU utilization
- High memory consumption
- Increased error rates
- Service downtime
- Excessive latency
- Network anomalies
Well-designed alerts enable teams to respond quickly before users experience service disruptions.
Summary
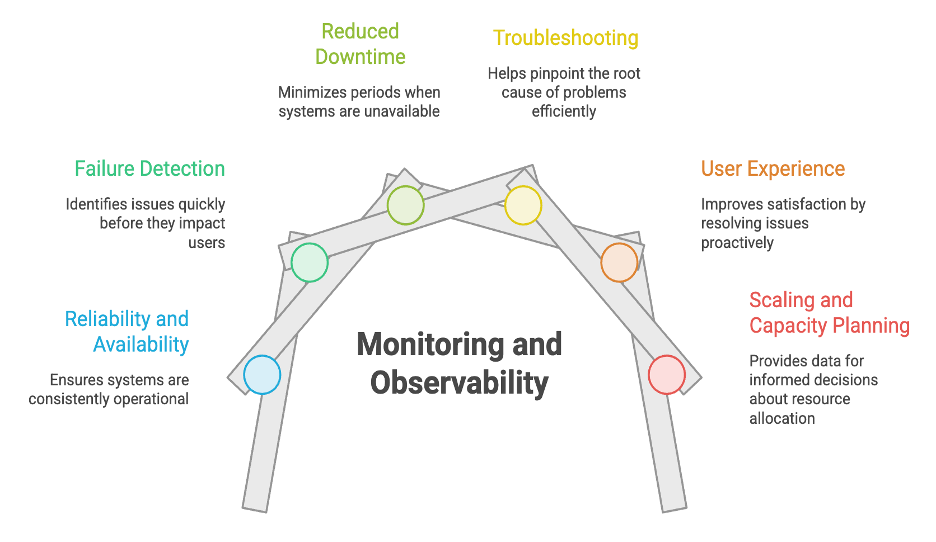
- Monitoring continuously tracks system health, performance, and availability using predefined metrics and alerts.
- Observability helps engineers diagnose the root causes of issues using metrics, logs, and traces.
- API monitoring focuses on throughput, error rates, health checks, and latency.
- Infrastructure monitoring focuses on CPU, memory, disk I/O, and network I/O.
- Latency percentiles (P90, P95, and P99) provide a more accurate representation of user experience than average latency.
- Effective monitoring combined with proactive alerting enables faster issue detection, quicker recovery, and improved system reliability.
Written By: Muskan Garg
How is this guide?
Last updated on